If your system has crashed and experienced a Blue Screen of Death (BSoD), or a program or Windows feature suddenly crashes, Windows automatically generates a record of the conditions and circumstances under which the error occurred. This information is stored in dump files with the extension “.dmp.”
These dump files can help troubleshoot the root cause of the error so that it does not occur again.
This article contains everything you need to know about these dump files and how they can be opened in Windows, since there is no native method, so they can be analyzed to determine the cause of the error.
Table of Contents
Windows Crash Dump Files
Crash dump files, also known as “mini-dump files,” are system-generated binary files that contain various information about a crash that may have occurred on your computer. Like Event Viewer, these files can be used to determine the cause of the error, and then use that data to fix it. Dump files can contain the following data in them, which can be helpful for the matter:
The list below highlights the content which can be found inside a mini-dump file.
- The Stop message (error code), its parameters, and other data.
- List of loaded drivers.
- The processor context (PRCB) for the processor that stopped.
- Process information and kernel context (EPROCESS) for the process stopped.
- Process information and kernel context (ETHREAD) for the thread stopped.
- Kernel-mode call stack for the thread that stopped.
Dump files are created by copying the data off the system memory and onto the computer’s storage. It uses the Windows Page File and requires at least 2MB of free space. With this information, you can understand how different dump files are created.
Windows can write debugging information in three types of dump files.
Types of Dump Files
Complete Memory Dump
Complete Memory Dump files are the largest of the dump files. In this case, the complete contents of the memory are written onto the dump file.
When generated by the system, all old Complete Memory Dump files are replaced and overwritten.
Complete Memory Dump files are saved to C:\Windows\MEMORY.DMP file.
Kernel Memory Dump
Kernel Memory Dump files only contain data from kernel memory, which is why they are relatively smaller in size. Such files do not contain data from any unused, unallocated memory or the memory used by user-mode programs.
When generated by the system, all old Kernel Memory Dump files are replaced and overwritten.
Kernel Memory Dump files are also saved to C:\Windows\MEMORY.DMP file, the same as Complete Memory Dump files. However, only one of these is saved at a time and is overwritten when another crash occurs.
Small Memory Dump/Mini Memory Dump
The minidump file, which we will discuss in this post, is the smallest kind of dump file. This file contains the information described above that can assist in determining the cause of the crash.
Minidump files generated by the system are not overwritten. Instead, a new one is generated.
Minidump files can be found at C:\Windows\Minidump. If you do not find a directory named “Minidump,” it is likely because a dump file has not been created yet.
When a minidump file is created, Windows automatically includes the date it was created on. For example, in Windows 11, if a file is named “020322-18890-01.dmp,” “02” indicates the month, “03” indicates the date, and “22” indicates the year the file was created. “-01” at the end indicates it was the first dump file created that day.
The same is true for a minidump file created in Windows 10, which is automatically named something like “mini020322-01.dmp.”
Now let’s move on to opening and analyzing a dump file.
How to Read and Analyze DMP Files
As we mentioned, Windows does not allow you to open dump files directly. However, you can use other tools available online to open and analyze them. One of the most common tools to do so is through the Windows Debugging (WinDbg) tool, which can be downloaded through Microsoft Store. Continue reading the given guide below to use this tool to open and analyze memory dump files in Windows.
Using WinDbg
We have divided this section into 2 parts: Downloading and installing the WinDbg tool and then using it to analyze a dump file.
Download and Install WinDbg
- Open the WinDbg Preview page in the Microsoft Store and click Get.

- The browser will prompted you to open the Microsoft Store app, click Open Microsoft Store.

- From the Store app, click Get again.

The WinDbg tool will now begin to download and then install. We are now done with the installation phase. Let us now use the tool to open and analyze dump files.
Open and Analyze dmp files using WinDbg
- Open the WinDbg tool with administrative rights by searching for it through the search box, right-clicking it, and then clicking Run as administrator from the context menu.

- From the WinDbg tool, click File from the top menu.
- In the Start Debugging tab, click Open dump file.

- Now click Browse from the right pane within the tool and select the dump file that you want to analyze by navigating to
C:\Windows\Minidump. When selected, click Open.
- The tool will now open the dump file, which can take a few minutes. When the dump file successfully opens, type in the following command in the text field in front of “0: kd>“:
!analyze -v
- WinDbg will now begin analyzing the dump file. This can take a few minutes to complete. Once completed, you should see the results in the top window.

In the example above, since we initiated a BSoD intentionally, it states “The user manually initiated this crash dump.” Otherwise, if it were an actual error, you would see different statements and information after performing the analysis of the dump file.
You can then use this information to troubleshoot the error that caused the crash.
Using WhoCrashed

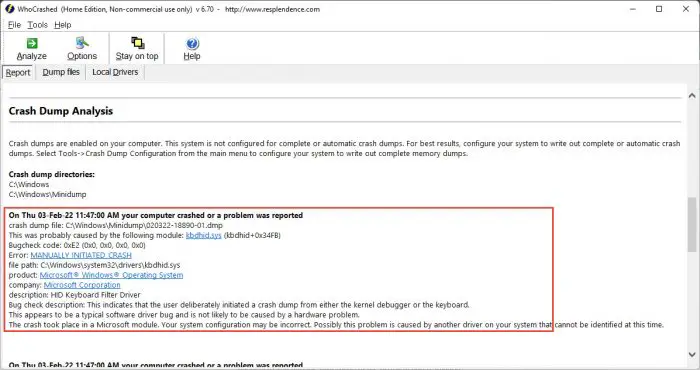
WhoCrashed is available in both free and paid editions. However, the free edition is sufficient to open and analyze dump files. With this tool, you can obtain reports on the dump files with a single click. The tool will automatically scan your system files for any .dmp files and fetch the data within.
To do so, download WhoCrashed from the link given above, and run the .exe file to install in a few easy steps. Once installed, click Analyze from the ribbon menu at the top. The tool will then take a few seconds to scan any dump files and present the analysis. You can also view the .dmp files discovered from the Dump files tab.
Using BlueScreenView

BlueScreenView is a portable and small tool that can provide you with relevant information on minidump files. When you run this tool, it automatically picks up any .dmp files in the Minidump directory and displays the relevant information gathered from them. If there are multiple .dmp files, you can click on the one you want to analyze from the top field within the tool, and the information is presented in the bottom one.
Simply download the app from the link given above, extract the content and run the BlueScreenView application.
Final Thoughts
Dump files, regardless of their type, can be pretty useful when it comes to troubleshooting your operating system. However, the methods we have used above to analyze them may not be everyone’s cup of tea, as some of you may find them complex.
That said, there are more methods to analyze dump files using tools, but they involve using the Command prompt, not a Graphical User Interface (GUI). If you’d still like to learn more about it, you can read this detailed post by Microsoft on memory dump files.


