
Key Points
- On Windows, boot into UEFI Firmware Settings from Settings > System > Recovery > Restart now, then click Troubleshoot > Advanced options > UEFI Firmware Settings. In the settings, look for the CPU Temperature.
- You can also use Core Temp, HWiNFO, HWMonitor, and other third-party tools to monitor per-core current temp, max temp, and min. temp.
The temperature of your system’s CPU highly affects its performance, and several reasons can lead to abnormal temperatures. On a Windows PC, there are multiple ways to check and monitor your CPU’s temperature and check if it is the culprit for a lagging performance.
CPU temperatures can drastically rise while performing CPU-extensive tasks, like playing games or performing complex calculations. This not only affects its performance, but it can also permanently damage the CPU and other associated hardware. Therefore, you must monitor its temperature under such circumstances.
Monitoring the CPU temperature allows you to take the appropriate action to maintain it, and keep it at an optimal temperature. This guide will show you multiple ways to check and monitor your CPU’s temp on Windows 11 and 10, both natively and using third-party tools.
Table of Contents
How to check CPU temp on Windows
Most modern computers come with embedded sensors that report certain parameters for different hardware, including the temperatures for each core of the CPU, information on the GPU, etc.
However, there is no native method to view the CPU temperature from within Windows. Instead, you must use either third-party tools and applications to monitor the CPU temp or boot into the UEFI settings.
Check CPU temp from system BIOS/UEFI settings
You can check the live temperature of the CPU from the system BIOS. However, to do so, you must restart the computer every time, which might not be convenient for everyone.
If you do not feel like restarting the computer, then skip to the other methods to monitor the CPU temp given below.
-
Press the Windows key + i to open the Settings app.
-
Go to System.
-
Click Recovery.

Open Recovery settings -
Click “Restart now” in front of “Advanced Startup“.

Restart into Advanced Startup The system will now boot into the Windows Recovery Environment (WinRE).
-
Click Troubleshoot.
-
Click “Advanced options.”
-
Click “UEFI Firmware Settings.”

Open UEFI Firmware Settings -
Click Restart.
The computer will now restart and boot into the UEFI firmware settings.
-
You should now be able to see the CPU temp on the main UEFI page. If not there, check a different page for the CPU information.
Note: If you do not see this information, then it is likely that your CPU is not supported by the UEFI, or the SMART technology is not available.


Monitor CPU temp using third-party apps
Core Temp
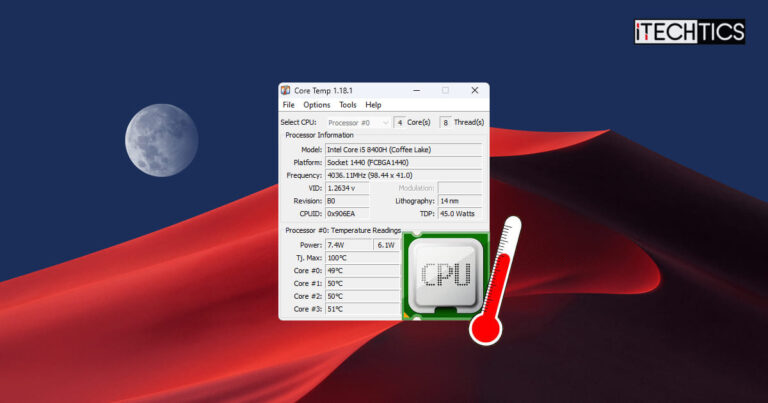
Core Temp is a free application that uses embedded sensors to provide you with fresh, current information on the system hardware, including the per-core current CPU temperature, max temperature, and minimum temperature. It also provides other information, like the power it is currently consuming, operating frequency, and complete model information.
Here are the steps to monitor the CPU temperature using Core Temp:
-
Download Core Temp.
-
Run the executable package and follow the on-screen instructions in the installation wizard to install it.
-
You can now view the CPU core temperatures under the “Temperature Readings” section.

Monitor CPU Core temperatures using Core Temp
In Core Temp, you will find the current temperature for each core, the minimum temperature it has reached, the maximum value, and the current load percentage as well.
When the application is running, you can also view the individual Core temperatures, in degrees Celsius, in the Quick Access menu.

HWiNFO
HWiNFO is another popular application that provides similar information to Core Temp. It is also free to use for non-commercial users. The only difference is the UI and the fact that the application needs to be installed from the Command Prompt.
Use the following steps to install HWiNFO and use it to monitor the CPU temperatures:
-
Press the Windows key + R to open the Run Command box.
-
Type in “CMD” and press CTRL + Shift + Enter to launch an elevated Command Prompt.
-
Run the following command to install HWiNFO:
winget install --id REALiX.HWiNFO
Install HWiNFO The app will then automatically run after installation.
-
Check the “Sensors-only” option and click Start.

Start the app -
If prompted for an Embedded Controller, click Continue.

Continue -
Inside the HWiNFO app, scroll down and view the temperature information for the CPU under the “CPU [#0] enhanced” section, or the temperature for individual cores under the computer model’s name section.
Note: The “CPU (Tctl/Tdie)” provides information for the AMD CPUs, and the “CPU Package” provides information for Intel CPUs.

Check CPU temperature using HWiNFO

HWMonitor
HWMonitor is another tool, very much like HWiNFO, that provides live information on the CPU temperature, as well as the temperature for individual cores, the maximum temperature, and the minimum temperature.
It is a lightweight application with less configuration and can be installed in a few simple steps. Here are the steps to install and run the HWMonitor application to check the CPU temperature:
-
Press the Windows key + R to open the Run Command box.
-
Type in “CMD” and press CTRL + Shift + Enter to launch an elevated Command Prompt.
-
Run the following command to install HWMonitor:
winget install --id CPUID.HWMonitor
Install HWMonitor -
Once installed, run the HWMonitor tool.
-
You should be able to see the CPU temperatures under the “Temperatures” subsection in the CPU section.

Check CPU temperature using HWMonitor

Other tools to monitor CPU temperature
Like the free and performing tools discussed above, there are many others available that can be used to monitor the CPU temperature and other hardware-related information as well. Here are some of the top tools on my list:
Optimal CPU temperature
If you regularly monitor your CPU temperature, you will notice that sometimes it is operating at relatively lower temps, while at other times, its temperatures are off the charts. This can happen depending on how much load it is bearing at that moment.
If you are performing CPU-intensive tasks, then the CPu temps are bound to rise. While tasks that don’t require much CPU processing go easy on the cores, hence causing less heat dissipation.
That said, the optimal CPU temperature during normal workloads should be between 40-65°C. However, it is normal for them to rise to 85°C during heavy workloads, such as playing a game.
If you find that the CPU temperatures are going well above the normal range for prolonged periods, then there might be an issue that needs resolving.
Note that the CPU temperatures might even rise above 85°C, which can be normal, provided that the rise is not constant and the temps return to optimal range in a few seconds after the cooling fans kick in.
Causes of high CPU temperatures
There can be several reasons why a CPU temperature is above the charts and operating in abnormal ranges. Here are a few common reasons:
- Extensive workload – one of the reasons for a CPU to reach high temperatures is because of high-intensity, continuous tasks. It may be possible that you are over-burdening the CPU with multiple CPU-intensive tasks, and therefore, it is reaching high temperatures.
- Overclocking – CPU overclocking is when you manually overburden the hardware to speedily perform tasks at its maximum capacity, which in turn can raise its temperature beyond the normal limits.
- Dried-up thermal paste – thermal paste is an excellent heat conductor, placed between a CPU and the heat sink. It often dries up when operating under high temperatures, and needs to be replaced for proper heat dissipation. If dried up the CPu can reach high temps and cause permanent damage.
- Faulty cooling fan – Cooling fans adjust their speeds automatically to keep the CPu and other hardware at optimal temperatures. When faulty, or not working at all, the hardware temps can rise. Check to see if all fans are working as they should.
- Dust buildup – Computers sitting idly for long periods can gather dust. Dust in the fans or on the hardware itself can hinder proper air ventilation. Proper cleanup and maintenance are advised before starting up a computer. Also, clean the computer hardware occasionally even when in use.
These are some of the common issues people face when experiencing high CPU temperatures. If you are seeing the same, then you may also be experiencing deteriorated system performance. Learn how to keep your CPU temperatures low and within optimal temperatures below.
How to keep CPU temperatures down
System hardware requires regular maintenance for all of it to perform well. Here are a few things you should do and look out for to maintain your CPU temperatures and prolong the CPU life in return:
- Keep the hardware clean – Dust bunnies often accumulate on idle and in-use computers, which prevents proper air ventilation for heat dissipation. Therefore, periodic cleaning is recommended through vacuum and leaf blowers.
- Use a ventilated laptop stand – Laptop stands prevent blockage of the air vents, ensuring proper air ventilation. Some stands even come with extra fans attached.
- Keep the environment cool – Do not use your computers in enclosed and hot places. Make sure that there is plenty of air circulation around the entire computer, with optimal temperatures.
- Close unused and background applications – apps running in the background still consume system resources. Close them when they are no longer needed to make sure that the CPU is not burdened with workload any more than it has to.
- Regularly perform malware scans – Some malware consumes 100% of the CPU for prolonged periods, resulting in elevated operating temperatures. Make sure that your computer is malware-free by performing regular checks and scans.
- Shut down the computer when not in use – Leaving your computers on overnight does not give the hardware the cooling time it needs, resulting in higher operating temps. It is recommended to switch off the computer when not in use.
How to check if CPU is heating?
One may not always keep an eye on the CPU’s temperature. So what other ways are there to tell whether the CPU is overheating or not?
Physically checking whether the CPU or its heat sink is hotter than normal is not the way to go about it. Instead, you may experience lag and degraded system performance when the CPU is overheating. Occasionally, you may even smell the thermal paste burning, if you are sitting close enough.
These are the only observations you can make to conclude that the CPU is overheating. If you do observe them, use one of the methods given above and check the CPU’s current temperature, as well as the maximum value to confirm your hunch.
Takeaway
CPU temperatures need to be monitored and maintained for optimal performance and increasing the life of the hardware. Periodic cleaning and other maintenance, such as replacing the thermal paste once a year is recommended. Also, make sure that the system’s ventilation, both inside and out, is in top shape and operating temperatures are optimal in the environment.
If you observe degraded system performance or lag, keep one of your preferred tools handy to check the CPU temperature.


